BI
A full picture of your business, a few drags away
Self-serve BI dashboards: drag-and-drop configuration, drill-downs and chart linking, proactive alerts, dashboards embeddable into business pages, and available on mobile.
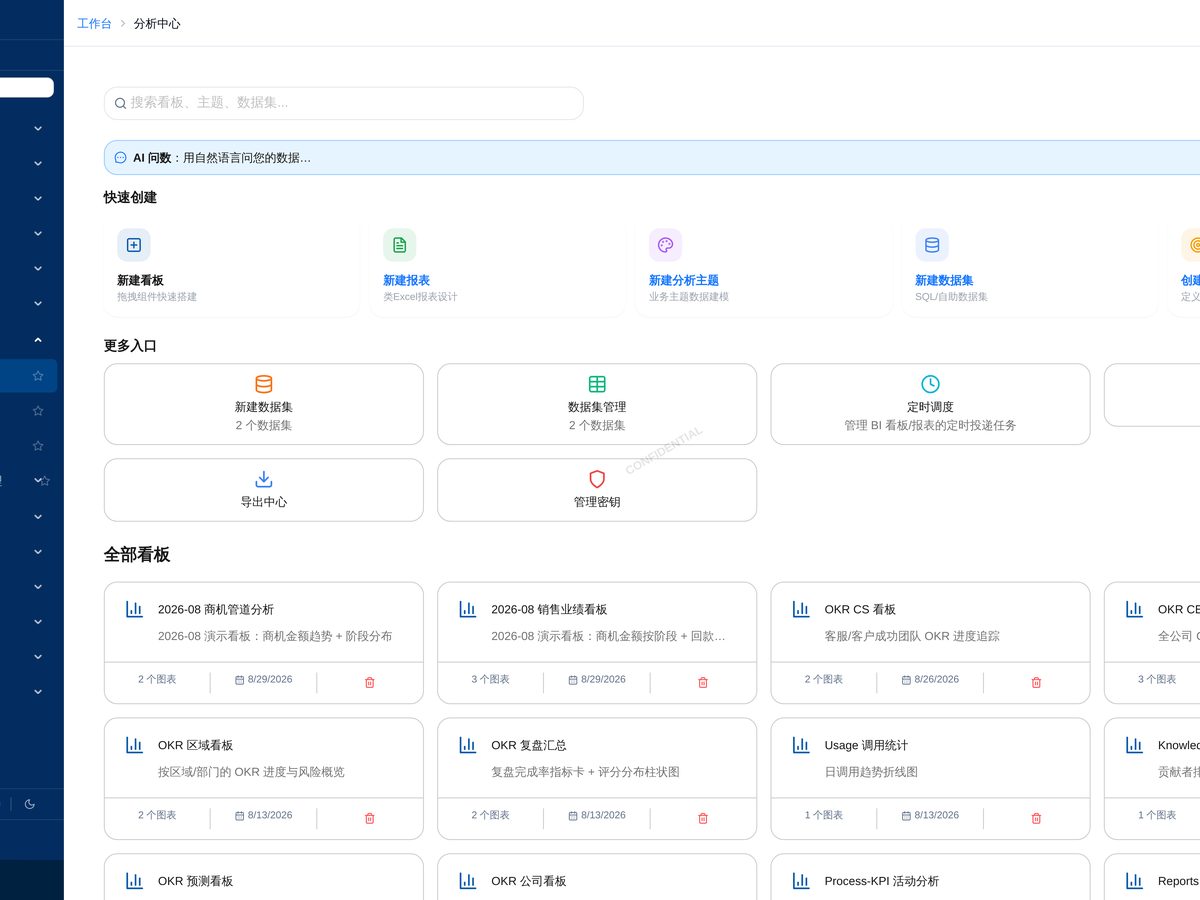
Product Screenshots
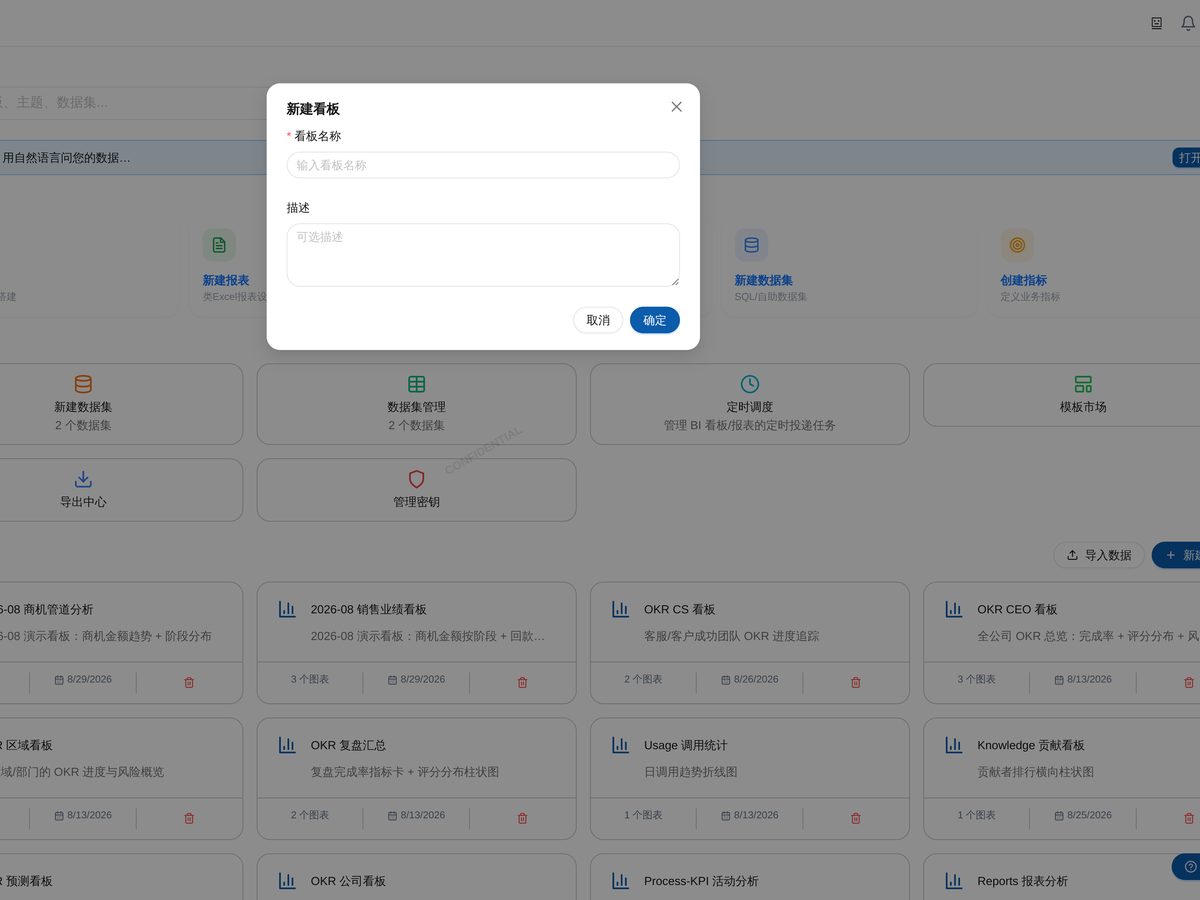
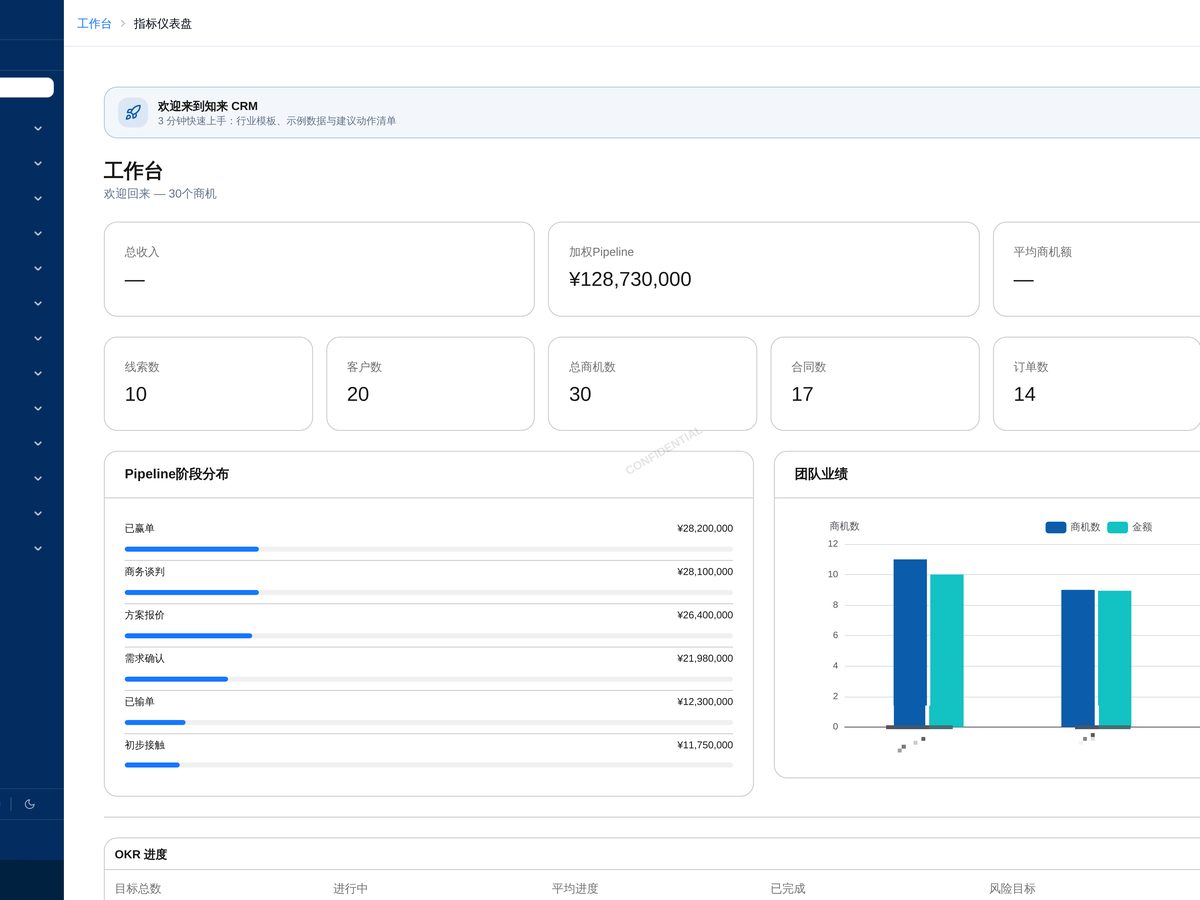
It solves these problems
Pain pointThe data is all in the system, but getting a single number means exporting to Excel and processing it.
Zhilai CRMSelf-serve dashboards with drag-and-drop config — charts, filters, and drill-downs work out of the box, so business users do it themselves.
Pain pointPerformance anomalies surface at month-end review, when it is too late to fix.
Zhilai CRMAlert rules with scheduled checks push a notification to the owner the moment a metric goes wrong.
Pain pointDashboards and the business system live apart — you have to switch back to take action.
Zhilai CRMDashboards embed directly into CRM business pages, so seeing and acting happen on one screen.
Features
- Visual dashboard designer
- 20+ chart types
- Drill-down & chart linking
- Multi-source datasets (incl. SQL mode)
- Alert rules
- Scheduled snapshot delivery
- Dashboards embedded in business pages
- Mobile dashboards
Frequently Asked Questions
Do I need SQL for BI?
No. The dashboard designer is fully visual, and business users can build dashboards on their own. Technical users can switch to SQL data-source mode for complex queries.
Where does BI data come from?
By default it analyzes business data inside Zhilai CRM directly; datasets also support multi-source queries, including external data sources.
How do I set up alerts?
Configure threshold rules on metrics or charts — for example, "payment overdue > 7 days" — and the alert is pushed automatically to the assigned owner when triggered.